Target Diversity: US vs China
Comparing the spread of drug targets across 126,348 patent-target entries
Overview
Which country's biopharma patent landscape is more diverse? We classified every patent family by its origin country and compared the distribution of drug targets (gene symbols) between CN China (62,463 target entries) and US United States (63,885 target entries).
Country classification uses the filing jurisdiction from DOCDB
patent family records. For direct national filings, this is the canonical country.
For PCT (WO) filings — which account for a large share of US-origin patents —
we resolve the receiving office from the WO application number
(e.g. US0010384 = filed at USPTO), recovering ~148K US-origin and ~30K
CN-origin families that would otherwise be lost.
The numbers
| Metric | CN | US | Interpretation |
|---|---|---|---|
| Total target entries | 62,463 | 63,885 | Nearly equal volume once WO origins are resolved |
| Unique targets | 6,700 | 6,213 | CN explores 8% more distinct genes |
| Shannon entropy (bits) | 10.32 | 10.69 | US is more diverse (higher = more spread) |
| Normalized entropy | 0.812 | 0.848 | US distributes effort more evenly relative to its target count |
| Simpson diversity | 0.9965 | 0.9982 | Two random US patents are more likely to target different genes |
| Gini coefficient | 0.773 | 0.748 | CN targets are more unequally distributed |
| HHI | 0.0036 | 0.0018 | CN is 2x more concentrated |
| CR-10 (top 10 share) | 13.7% | 9.0% | CN's top 10 targets capture 50% more of the landscape |
| CR-50 (top 50 share) | 28.6% | 20.9% | Same pattern extends further down the ranking |
| Singleton targets (n=1) | 2,813 | 2,302 | Both have long tails of explored-once genes |
| Mega-targets (n>100) | 91 | 89 | Similar count of heavily-patented targets; CN concentrates more per target |
Rank-frequency distribution
Both countries follow a power-law (Zipf-like) distribution: a few targets attract enormous patent volume while thousands of genes have only a handful of filings. On a log-log scale, a steeper drop indicates higher concentration. China's curve sits above (more volume) but drops off faster at the tail.
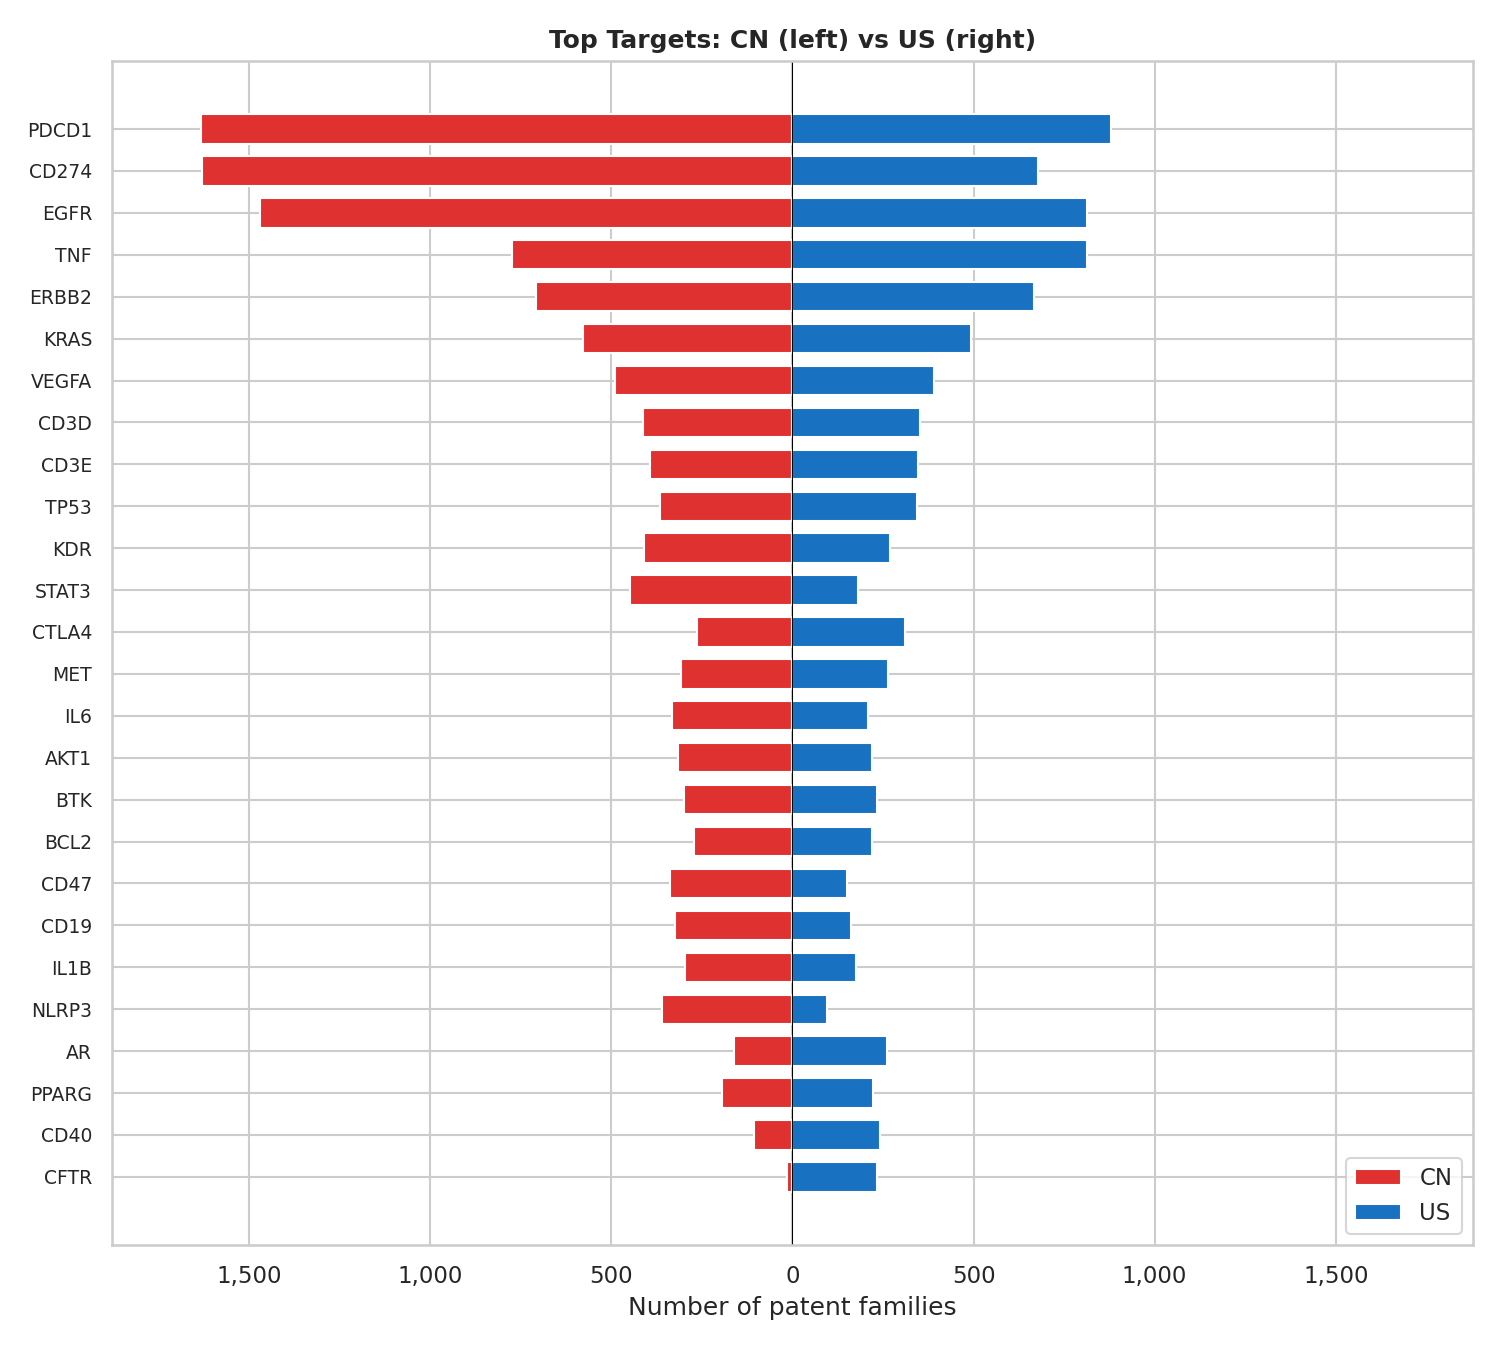
Head-to-head: top targets
The diverging bar chart below shows the union of each country's top 20 targets. China's landscape is dominated by immuno-oncology checkpoints — PDCD1 (PD-1), CD274 (PD-L1), and EGFR each exceed 1,000 CN families. The US top targets are more balanced: TNF, EGFR, and ERBB2 (HER2) lead with comparable absolute counts to each other, and a broader mix of inflammatory, metabolic, and oncology targets fills out the top 20.
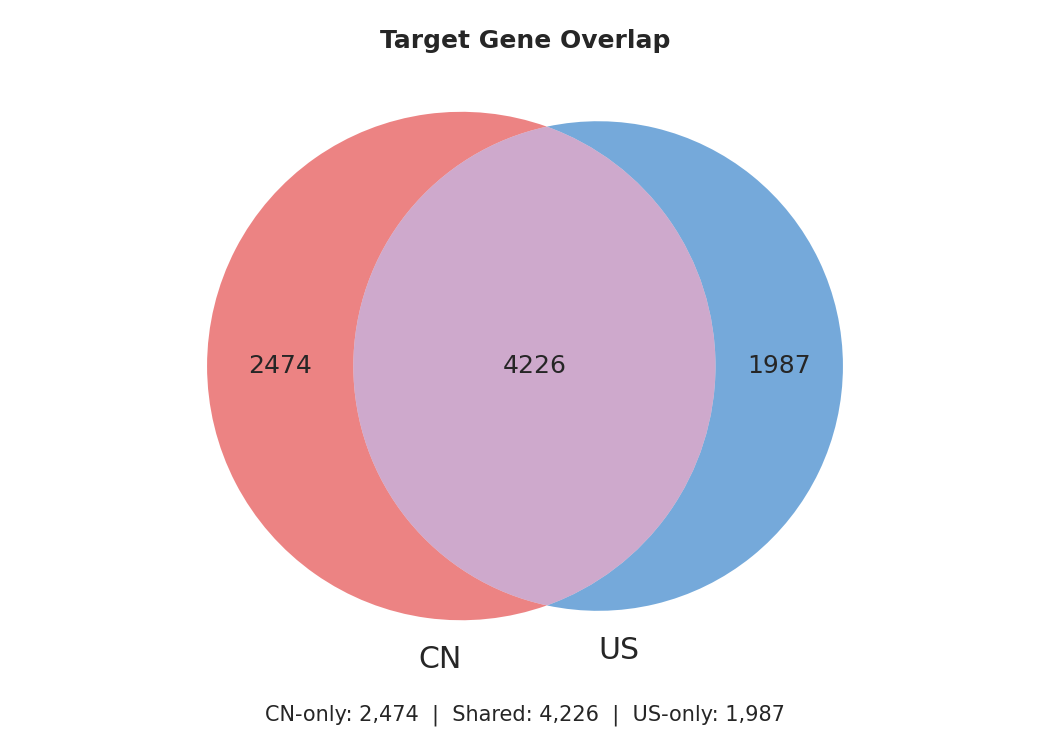
Target overlap
Of the 8,687 unique targets across both countries, 4,226 are shared (49%). China has 2,474 genes not found in US filings, while the US has 1,987 exclusive targets. With WO origins resolved, the overlap is much larger than it first appeared — nearly half of all targets are pursued in both countries.
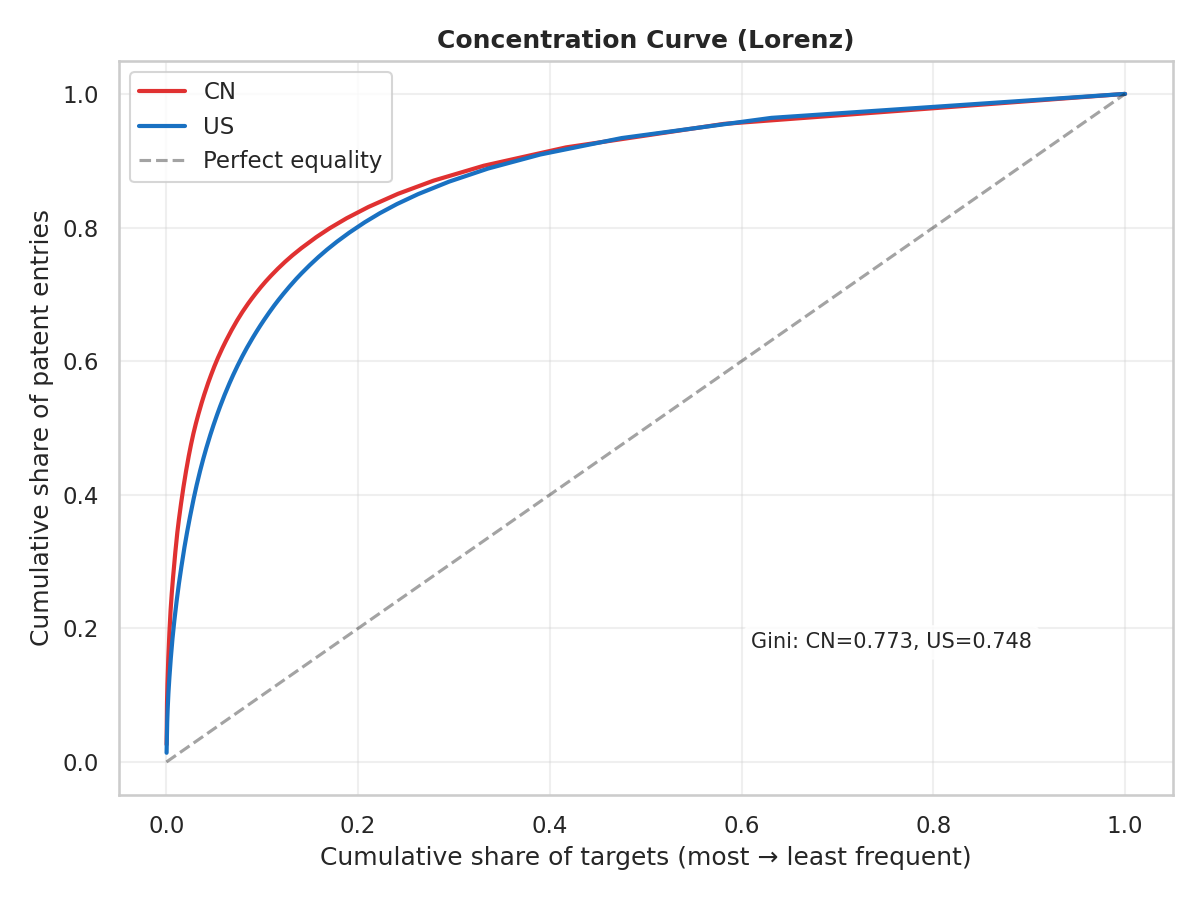
Concentration curves
The Lorenz curve plots cumulative share of patent entries against cumulative share of targets (sorted from most to least frequent). A curve bowing further from the diagonal indicates higher concentration. China's Gini coefficient of 0.773 vs. the US's 0.748 confirms that a smaller fraction of targets captures a larger share of Chinese patents — though the gap is narrower than raw counts suggest.
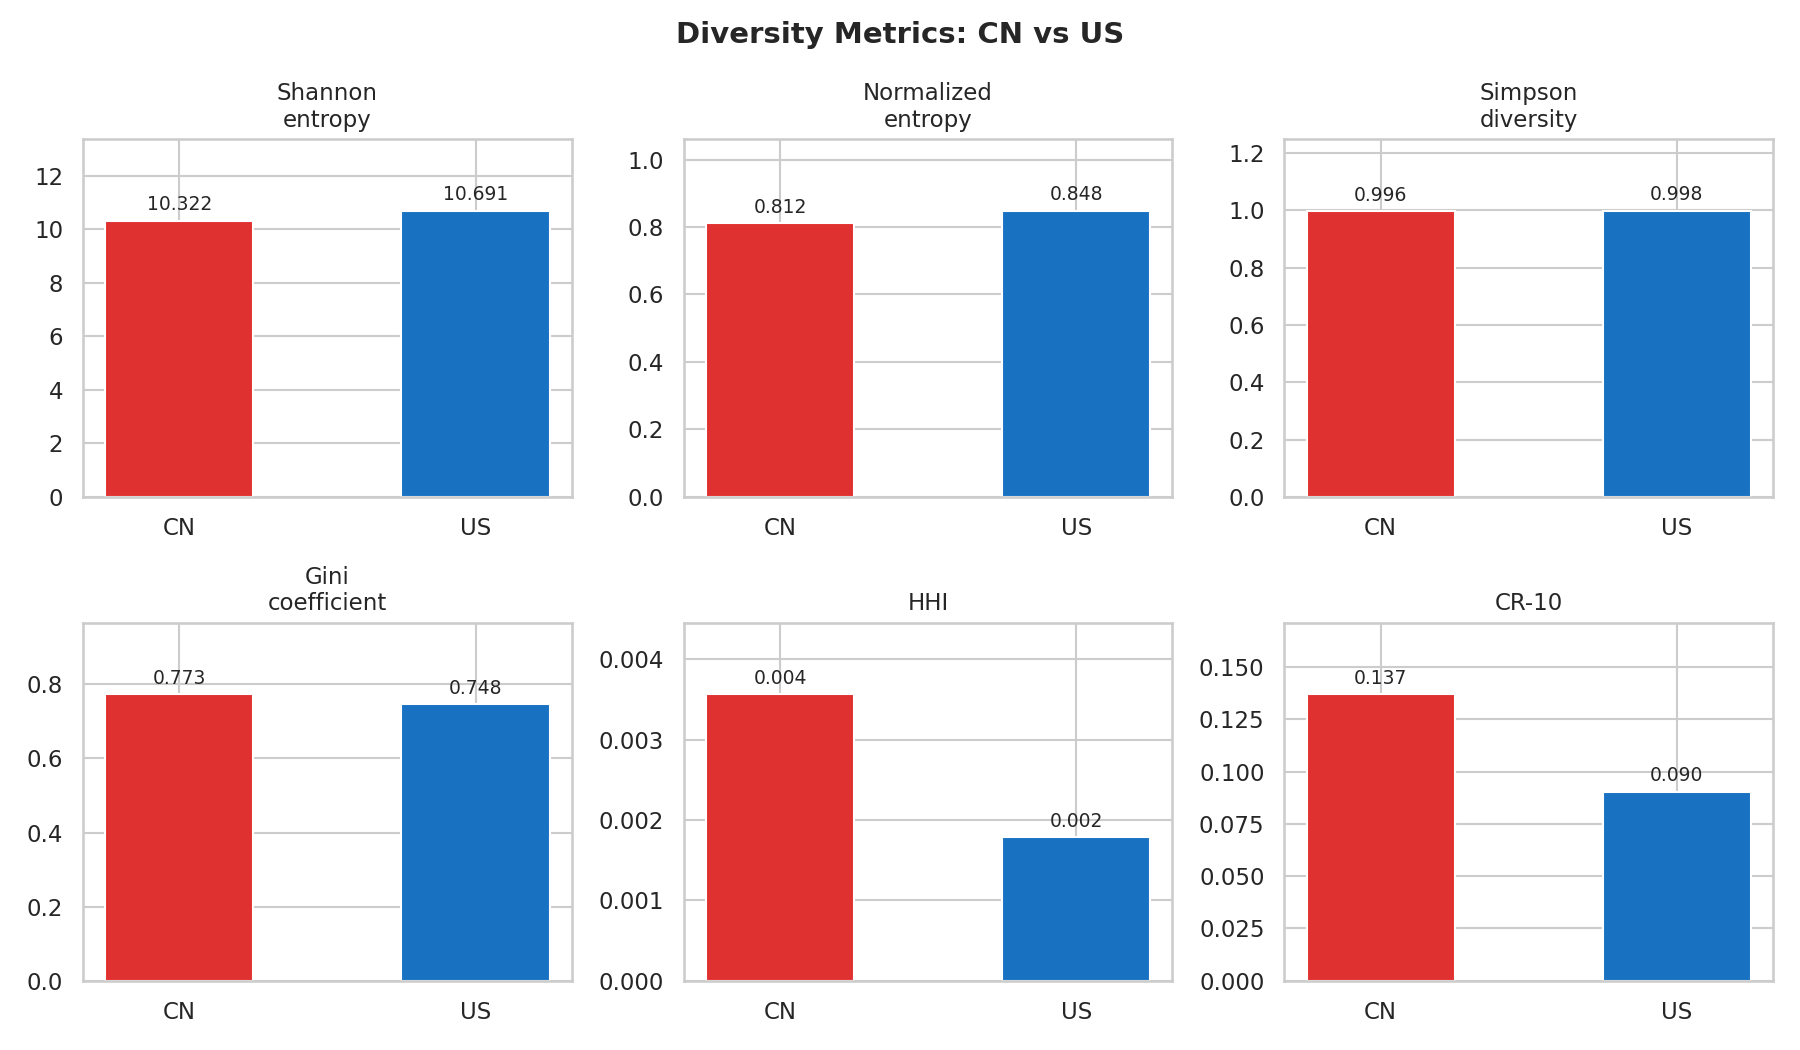
Diversity metrics at a glance
Takeaways
At equal volume, the concentration gap persists. With WO origins resolved, both countries have ~63K target entries — making the comparison apples-to-apples. CN and US now have similar mega-target counts (91 vs 89), but China concentrates far more heavily on its top targets. The HHI is 2x higher for CN (0.0036 vs 0.0018).
The US distributes effort more evenly. Every diversity metric (Shannon entropy, Simpson index, normalized entropy) is higher for the US, while every concentration metric (Gini, HHI, CR-10/20/50) is lower. This suggests US patent filings reflect a broader spread of therapeutic bets rather than clustering around consensus targets.
Immuno-oncology drives the CN concentration. The top 3 CN targets (PDCD1, CD274, EGFR) are all immuno-oncology workhorses, accounting for ~8.5% of all CN target entries. The equivalent top 3 in the US (TNF, EGFR, ERBB2) account for ~4.5%. China's "me-too" innovation pattern in checkpoint inhibitors is clearly visible in the data.